
White basmati rice sits around GI 50-58 when cooked al dente, while a bowl of poha or plain white rice can run past 70. A single roti made from stone-ground whole wheat lands in the medium range near 60-62, but the same flour cooked as a paratha with added fat drops slightly lower. If you have ever wondered why two “healthy” Indian meals affect your blood sugar so differently, the answer is almost always sitting in a glycemic index (GI) chart like the one below.
This article is a practical reference: real, published GI values for the foods that show up on Indian plates every day, grouped so you can compare within a category (which rice, which dal, which fruit) rather than guess. If you need the concept explained first, start with what glycemic index and glycemic load actually mean. If you already know the numbers and want to bring a high-GI meal down, see how to lower the glycemic index of your meals.
What counts as low, medium, and high GI?
The University of Sydney’s Glycemic Index Research Service, which maintains the world’s largest tested-food database (glycemicindex.com), uses three bands measured against pure glucose (GI 100):
- Low GI: 55 or below — digests slowly, produces a gradual blood sugar rise
- Medium GI: 56 to 69 — moderate impact, best paired with protein or fiber
- High GI: 70 or above — digests fast and can spike blood glucose quickly
Every value below is drawn from published testing — either the University of Sydney database, peer-reviewed Indian nutrition journals, or India’s National Institute of Nutrition (NIN) dietary guidelines. Where studies disagree (which happens often, since rice variety, ripeness, and cooking method all shift GI), we’ve noted the range rather than picking a single number to look tidy.
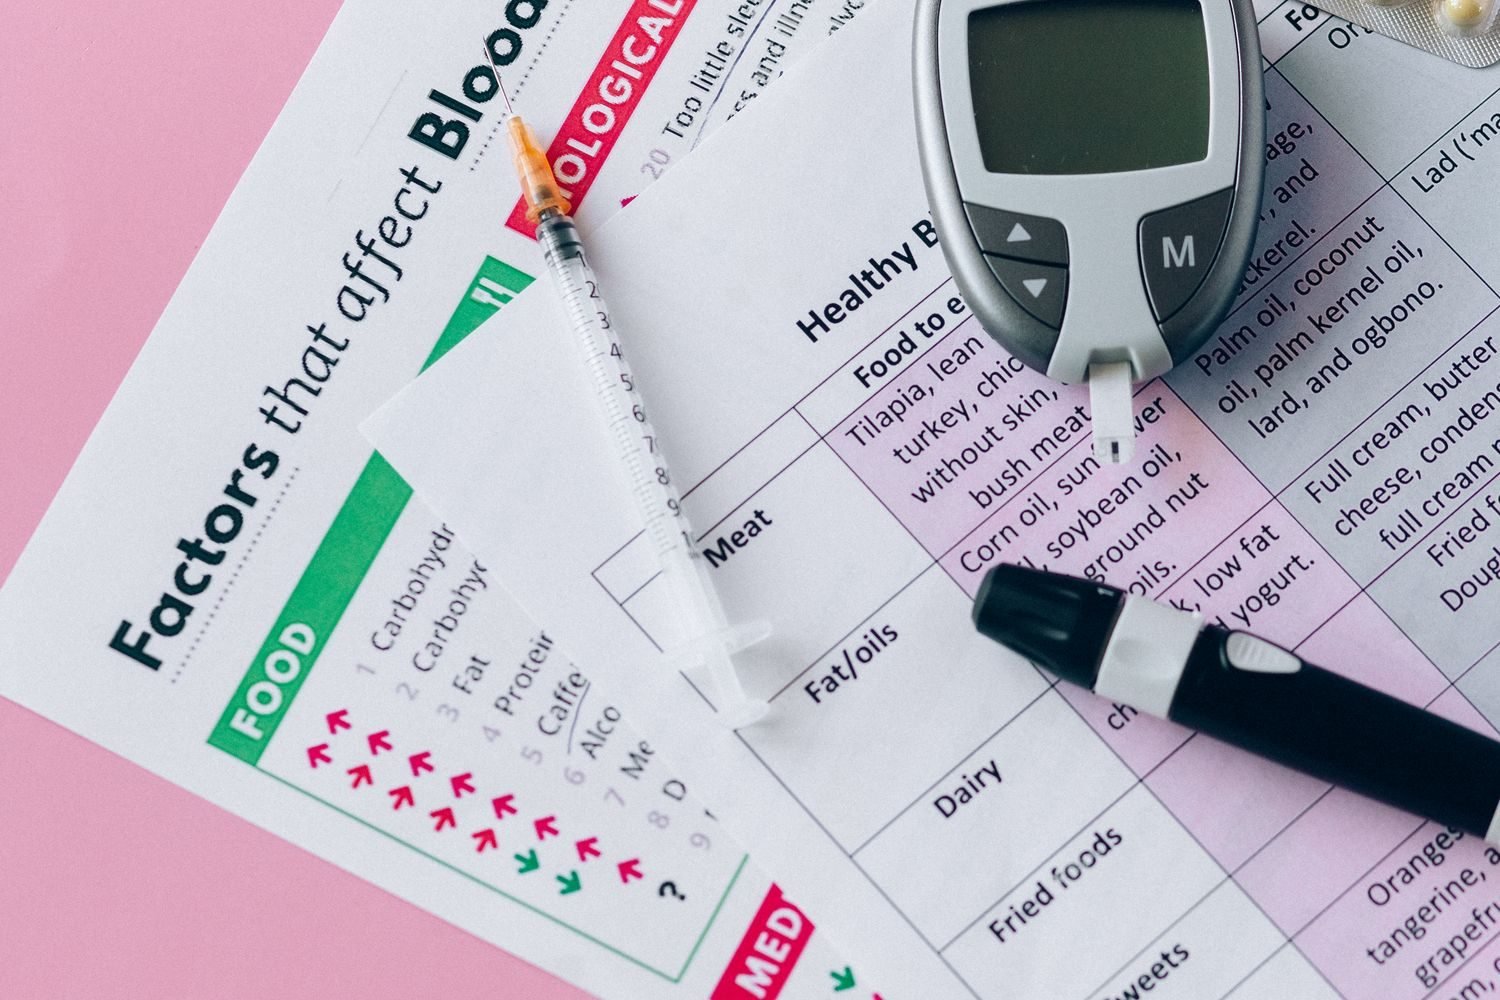
Which Indian rice and grains have the lowest GI?
Rice is where most of the confusion lives, because “rice” isn’t one food — grain length, amylose content, and how long you cook it all move the number.
| Food | GI Value | Category |
|---|---|---|
| Basmati rice (aged, cooked al dente) | 50-58 | Low to borderline-medium |
| Basmati rice (other tested varieties) | Up to 68 | Medium |
| Boiled brown rice | 64-72 | Medium to high |
| Plain white rice (regular, non-basmati) | 74-82 | High |
| Poha (flattened rice) | Varies with thickness/soaking | Medium to high |
| Ragi (finger millet), whole grain | Not individually specified | Low |
A multi-centric Indian study on a branded parboiled basmati found values under 55, while some Indian basmati samples tested notably higher depending on processing and cooking time. Boiled brown rice and plain white rice figures come from NIN Dietary Guidelines testing; the global average across tested white rice varieties is around 73. Ragi is a common swap for polished rice in South Indian diets.
The practical takeaway: basmati is not automatically “safe” and regular white rice is not automatically “bad” — variety, aging, and cook time matter more than the rice family name. Portion size and what you eat alongside the rice matter just as much; that’s the whole premise behind lowering the glycemic load of a meal rather than eliminating rice entirely.
Where do roti, chapati, and other Indian breads fall?
Wheat-based breads are frequently assumed to be uniformly low GI because they’re “whole wheat.” Testing tells a more mixed story.
| Food | GI Value | Category |
|---|---|---|
| Chapati (whole wheat, plain) | 56-69 (some studies: 52-65) | Medium |
| Roti (thin, minimal fat) | ~45 (varies by flour/thickness) | Low-medium |
| Paratha | 57-68 | Medium |
| Multigrain or besan-blended chapati | 45-55 | Low-medium |
The spread within “chapati” alone (56 to 69) is a good reminder that flour grind, thickness, and resting time before cooking all shift the number by 10+ points. This is exactly the kind of variable meal-lowering strategies target — adding fiber or protein to the same base bread.
Which dals and legumes have the lowest GI on the chart?
This is the best news category for anyone managing blood sugar in an Indian diet — dals and legumes are consistently among the lowest-GI foods tested anywhere in the world.
| Food | GI Value | Category |
|---|---|---|
| Masoor dal (red lentil) | 39-46 | Low |
| Green gram / moong dal | 38-47 | Low |
| Red gram / toor dal | 38-48 | Low |
| Bengal gram / chana dal | 32-44 | Low |
| Chickpeas (chole/kabuli chana), boiled or canned | 28-36 | Low |
| Kidney beans (rajma) | 24-51 (canned 29-36, home-cooked dried up to 51) | Low |
| Lentils generally (canned, drained) | ~42 | Low |
Even mixed-dal preparations like sambar or mixed dal khichdi tend to stay in the 37-51 range according to NIN data, largely because the fiber and protein in legumes slow carbohydrate absorption regardless of how they’re combined. This is why dal is the anchor recommendation in most diabetes-friendly snack and meal guidance.
What is the GI of common Indian fruits?
Fruit GI surprises people because ripeness changes the number substantially — a semi-ripe mango and a fully ripe one are not nutritionally interchangeable from a blood sugar standpoint.
| Food | GI Value | Category |
|---|---|---|
| Guava | Not individually specified | Low |
| Apple | Under 40 | Low |
| Banana (ripe) | 51-52 (unripe is notably lower) | Low-medium |
| Mango (ripe) | 51-60 (rises with ripeness) | Medium |
| Papaya | High-50s to 60 | Medium |
| Watermelon | 72-76 | High (but low glycemic load per serving) |
Watermelon is the classic case for reading glycemic load alongside glycemic index — a high-GI food eaten in a small, water-heavy portion doesn’t necessarily deliver a large sugar hit.
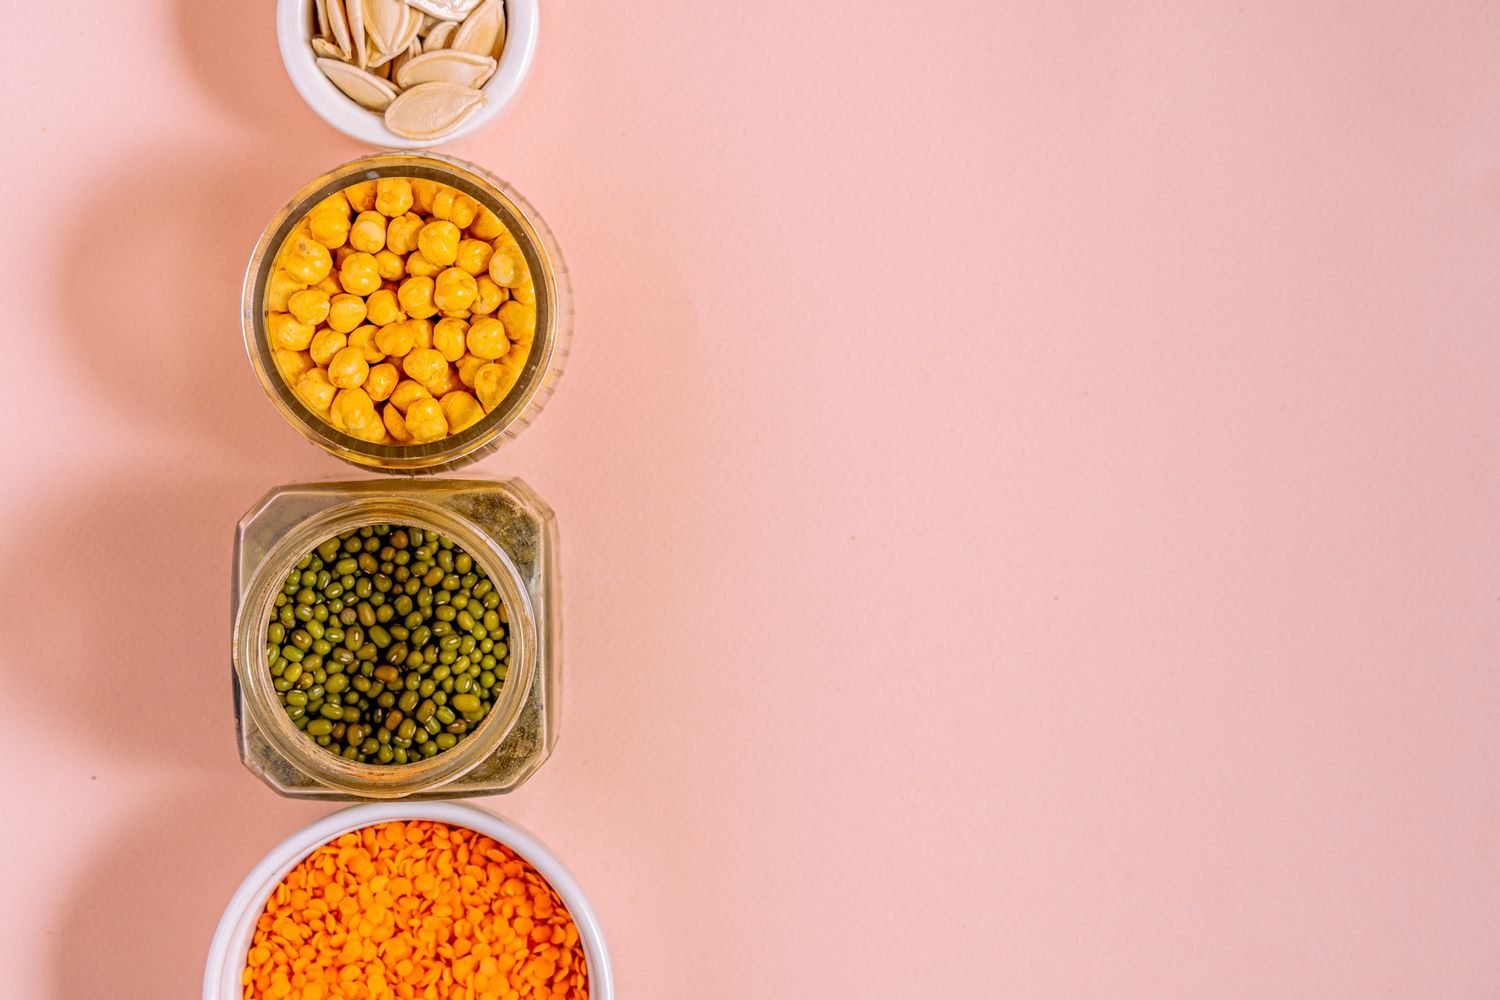
How do root vegetables and starchy sides compare?
Root vegetables are where a lot of home cooks unknowingly rack up glycemic load, since they’re often treated as “just vegetables.”
| Food | GI Value | Category |
|---|---|---|
| Boiled potato (white) | 78-82 (average) | High |
| Sweet potato | ~70 (boiled tests lower than roasted/fried) | Medium-high |
| Carrots (cooked) | Not individually specified | Low |
| Beetroot | Not individually specified | Medium (low glycemic load per serving) |
Cooking method is the biggest lever here — a boiled, slightly-underdone potato tests lower than a mashed or long-boiled one, because gelatinized starch is digested faster. The same logic applies to sweet potato, where roasting concentrates sugars and raises GI compared to boiling.
What about South Indian breakfast staples like idli and dosa?
Fermented rice-and-lentil batters are often assumed to be low GI because of fermentation, but tested values tell a different story for the standard versions.
| Food | GI Value | Category |
|---|---|---|
| Idli (standard rice idli) | 70-78 | High |
| Idli with sambar | 63-75 | High |
| Plain dosa | 72-86 | High |
| Vegetable dosa | 58-70 | Medium-high |
| Upma (semolina-based) | 65-78 | Medium-high |
| Brown rice idli (modified recipe) | ~51 | Medium |
The standard idli figure draws on most Indian studies, including Indian Journal of Medical Research testing; the brown rice idli figure comes from one peer-reviewed study using a modified recipe.
This category is genuinely useful to know because idli and dosa have a reputation as “light” or “diet” food that the GI data doesn’t fully support — the fine rice batter and fermentation actually raise digestibility speed rather than lowering it.
Which Indian snacks are lower GI, and which spike blood sugar fastest?
| Food | GI Value | Category |
|---|---|---|
| Roasted chana (dry roasted chickpeas) | Not individually specified | Low |
| Peanuts | Not individually specified | Low (calorie-dense) |
| Vada sambar | 31-43 | Low-medium |
| Mysore bonda | 56-67 | Medium |
| Bisi bele bath | 69-80 | High |
| Vegetable biryani | 68-81 | High |
| Lemon rice | 74-85 | High |
For a longer, curated list built specifically around blood sugar management, see diabetes-friendly snacks.
How should you actually use this chart day to day?
A GI number in isolation is a data point, not a diet plan. Three things make it usable:
- Compare within categories, not across them. Comparing chapati’s GI to watermelon’s GI isn’t useful — compare chapati to rice, or one dal to another, when deciding what to swap.
- Combine high-GI foods with low-GI ones. Rice with dal, dosa with sambar and coconut chutney, or fruit with a handful of nuts all blunt the blood sugar response of the higher-GI component.
- Check portion size (glycemic load), not just GI. Watermelon’s high GI matters less than its low glycemic load per serving — this distinction is explained fully in our glycemic index vs. glycemic load guide.
If you’re building full-day meal structures around these numbers rather than single-dish swaps, a 7-day diabetes meal plan puts this chart into an actual weekly rotation, and a broader diabetes nutrition reference covers how GI fits alongside carb counting and portion control.
Frequently asked questions
Is basmati rice always lower GI than regular rice?
Usually, but not always. Aged basmati cooked al dente has tested as low as GI 50-58 in Indian studies, while some basmati samples tested up to 68. Regular white rice typically tests 74-82. Basmati is the better average choice, but variety and cooking time still matter.
Why does chapati have such a wide GI range (56 to 69)?
Flour grind, thickness, resting time, and whether the dough includes bran all shift chapati’s GI. NIN testing reports a 56-69 range rather than one fixed number, which is why two home-made rotis can behave differently in the same person.
Are idli and dosa bad for blood sugar despite being “light” food?
Standard rice idli (GI 70-78) and plain dosa (GI 72-86) test high because of the fine rice batter and fermentation speed of digestion. Pairing with sambar, adding vegetables, or using brown rice/millet batters brings the number down meaningfully.
Why is watermelon high GI but still considered okay in moderation?
Watermelon’s GI (72-76) is high, but its glycemic load per typical serving is low because it’s over 90% water with relatively little carbohydrate per gram. A small bowl doesn’t deliver the same sugar load its GI number implies.
Which dals have the lowest GI for daily use?
Chana dal (32-44), chickpeas (28-36), and masoor dal (39-46) rank among the lowest-GI legumes commonly eaten in India, per NIN and University of Sydney data. All are good daily staples for stable blood sugar.
Numbers on a chart are a starting point, not a full plan — how these foods combine in your actual meals, portions, and daily rhythm is where the real difference gets made. If you want that mapped out for your specific health goals, an online nutritionist consultation can turn this reference into a plan you’ll actually stick to.